The current climate of Chile features average monthly temperatures ranging from highs of 30°C during the day to lows of 14°C. The average yearly temperature is around 22°C. At night, temperatures in the colder months average around 4°C and in the warmer months around 14°C.
The highest temperature recorded in Chile in recent years was 38°C in January 2014. The lowest daytime temperature recorded was 0°C in January 2018.
On average, Chile gets 649 mm of precipitation each year, including rain, snow, and hail. Of this, about 1,4 cm is snowfall. For comparison, United Kingdom gets 862 mm of precipitation each year.
The climate of Chile is based on weather data from Santiago. Other locations might differ.
Click on the month name to see more weather details, like daily averages, temperatures, and precipitation for the past years in that month.
The best time to visit Chile for sunny weather is January through April and August through December. During this period, you'll have good temperatures and not too much rain, making it a great time to visit Chile. In the other months of the year, there's too much rain or the temperature isn't ideal for a visit if you want sunny and pleasant weather.
The climate table of Chile shows the average temperatures, precipitation, snow, and UV index per month. The table gives an overview of the average day and night temperatures in degrees Celsius, the total amount of precipitation in millimetres, the total snowfall in centimetres, and the UV index for each month. Precipitation is always measured as water, even if it's snow or hail.
Wettest months: 148 mm in June, 93 mm in July and 85 mm in September
*Precipitation is measured as a combination of rain, snow, and hail
Average Temperature per Month in Chile
This graph shows the average maximum temperatures per month in Chile. The temperatures are shown in degrees Celsius and the average is calculated based on the recorded temperatures per month from past years.
Average Precipitation per Month in Chile
This graph shows how much precipitation Chile gets on average per month. Precipitation is always measured as water, even if it's snow or hail. This makes it easy to compare how much has fallen, regardless of the form of precipitation. The amount of precipitation is measured in millimetres and the average is calculated based on the recorded precipitation per month from past years.
Average Snowfall per Month in Chile
This graph shows how much snow Chile gets on average per month. The amount of snowfall is measured in centimetres and the average is calculated based on the recorded snowfall per month from past years.
Average UV Index per Month in Chile
This graph shows the average UV index per month in Chile. The UV index indicates the intensity of ultraviolet radiation and ranges from 0 to a maximum of 11.
Yearly Temperature in Chile
This graph shows the average yearly temperature in Chile. The yearly temperature, expressed in degrees Celsius, is the average of all twelve monthly temperatures summed up for that year.
Total Yearly Precipitation in Chile
This chart shows the total yearly precipitation in Chile over the past few years. The total yearly precipitation, measured in centimetres, is the sum of all the rain that fell in the twelve months of that year.
Total Yearly Snowfall in Chile
This chart shows the total yearly snowfall in Chile over the past few years. The total yearly snowfall, measured in centimetres, is the sum of all the snow that fell in the twelve months of that year.
Best Time to Visit Chile
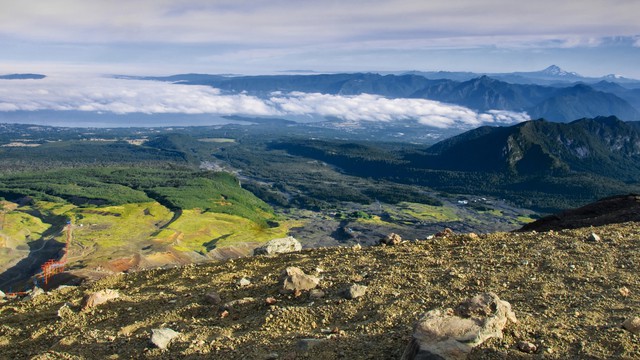
Chile, a country stretching more than 4,300 kilometres from north to south, offers an amazing diversity of climates, ranging from the world's driest desert in the north to temperate rainforests in the south.
The diversity of Chile's climate
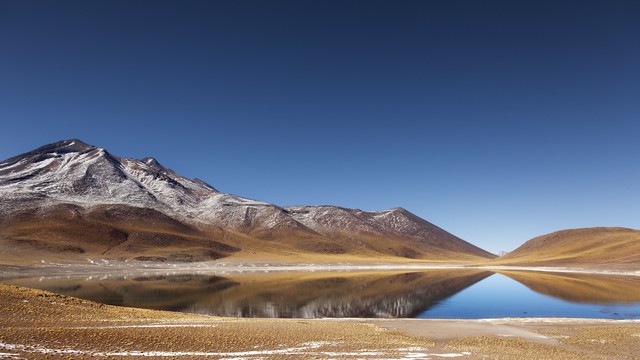
Chile's geographical location and topography play a crucial role in its wide variety of weather conditions. In the north lies the Atacama Desert, known as the driest place on earth, where some areas have not seen rain for centuries. Here, annual rainfall ranges between 200 and 500 mm, but in some parts even less than that falls, while the area enjoys around 2,200 hours of sunshine a year.
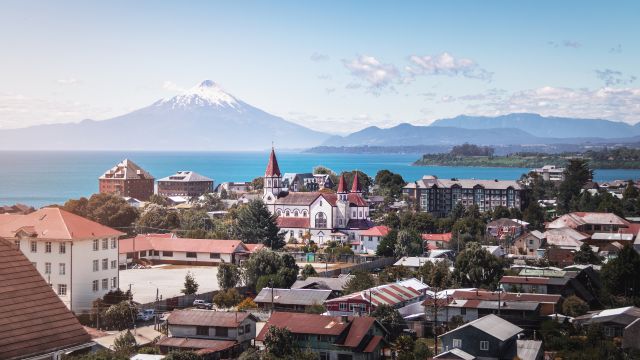
Central Chile, with cities like Santiago and Valparaíso, enjoys a Mediterranean climate with hot, dry summers and mild, wet winters. This area is ideal for agriculture, including vineyards that produce some of the world's best wines.
This area is ideal for agriculture, including vineyards that produce some of the world's best wines.
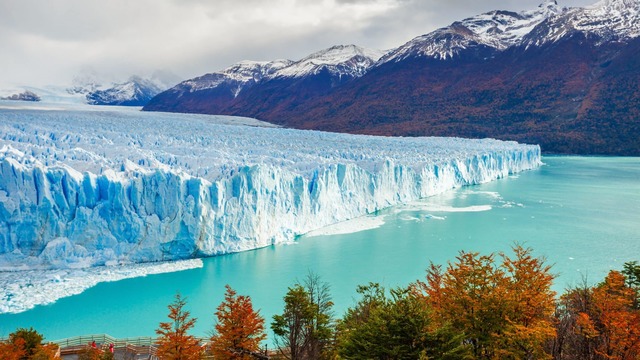
Southern Chile, including regions such as Patagonia, has a cooler climate with more rainfall, contributing to lush green landscapes and vast forests. The weather here can be unpredictable, with cold winters and temperate summers.
Climate averages and extremes
The average annual temperature for Chile is 19°C, with average daily temperatures ranging between 11 and 26 degrees Celsius. The coldest month is July, with an average temperature of 11 degrees Celsius, while January is the warmest month, with averages around 26 degrees Celsius.
The country has an average of 316 dry days a year, with an average humidity of 45% and a UV index of 4, contributing to the unique biodiversity and different ecosystems found in the country.
The impact of climate change
Climate change poses a growing threat to Chile's diverse ecosystems. From melting glaciers in Patagonia to longer droughts in the Atacama Desert, the effects are being felt all over the country. These changes affect not only natural habitats, but also agriculture, water supplies and the way of life of local people.
Weather experiences in Chile
The weather in Chile is rated an average of 3,9 out of 5 stars by 13 visitors. Have you been to Chile? Share your weather experience to help other visitors.
For sun worshippers, this is definitely a 5-star resort. This is the ideal place to relax and enjoy the summer.— This text is automatically translated to English
It was early spring, so it was a bit chilly at times, between 10 and 20 degrees, but generally favourable for outdoor activities. Some rain fell here and there, but nothing to worry about.— This text is automatically translated to English
The temperature was low but bearable. The sunrise and sunset were incredibly beautiful. Don't wait for the sun's rays. A visit to the thermal baths is a must!— This text is automatically translated to English
The days were mostly sunny with only a few moments of rain. The sea was invitingly cool. I simply missed the intense summer heat.— This text is automatically translated to English
February in Chile was just great. High temperatures of 25 to 30 degrees, constant sunshine and cool breezes. Ideal for a holiday on the coast or to enjoy Santiago's city life. No rain in sight!— This text is automatically translated to English
August is winter in Chile, when there is enough snow for winter sports and skiing. Temperatures range between -1°C and 7°C. The sun rarely shows itself and it can be quite cold. Not ideal for sun worshippers.— This text is automatically translated to English
We saw both rain and sunshine, cancelling some of our planned outdoor activities. It was not an ideal time for a beach holiday.— This text is automatically translated to English
October was a great time to visit Chile. Excellent spring temperatures, pleasant for both sightseeing and hiking. Unfortunately, we had cloudy days with less sunshine.— This text is automatically translated to English
It was winter and there was plenty of snow, which was perfect for experiencing all the beauty the country has to offer at this time of year. Definitely recommended for winter sports enthusiasts!— This text is automatically translated to English
November brought Chile a combination of sunshine and sporadic rain. Ideal for an adventure holiday, the weather was mostly pleasant, but be sure to bring an umbrella.— This text is automatically translated to English
Air temperatures were moderate, averaging around 20 degrees. Unexpected rain, but overall a good summer.— This text is automatically translated to English
The coast was too cool for swimming, but perfect for sightseeing. No heavy rains and mostly sunny days.— This text is automatically translated to English
Drove from Chaitén to Puyuhuapi today (29 Nov). Rain all day. Heavy in the evening.
Forecast for tomorrow and the day after in Puyuhuapi every hour from 0.5 (drizzle) to 4.5mm per hour!— This text is automatically translated to English
Have you been to Chile?
Share your weather experiences in Chile.
Average Weather in Chile by Month
Click on a month below to see detailed weather info for Chile. Based on historical weather data, you can see the average temperature, precipitation, wind, and UV index for each day of the month.