What’s the climate like in Portugal?
The current climate of Portugal features average monthly temperatures ranging from highs of 29°C during the day to lows of 17°C. The average yearly temperature is around 23°C. At night, temperatures in the colder months average around 9°C and in the warmer months around 20°C.
The highest temperature recorded in Portugal in recent years was 40°C in August 2021. The lowest daytime temperature recorded was 9°C in January 2021.
On average, Portugal receives 311 mm of precipitation each year. For comparison, UK gets 701 mm of precipitation annually.
The climate of Portugal is based on weather data from Algarve. Other spots, like Lisbon, Albufeira or Madeira, might have different weather. You can check out all destinations in Portugal for a full picture of the climate.
Check out the weather for Portugal 
Best time to visit Portugal?
The best time to go for a sun holiday to Portugal is March through December. During this period, you'll have good temperatures and not too much rain, making it a great time to visit Portugal. In the other months of the year, there's too much rain or the temperature isn't ideal for a visit if you want sunny and pleasant weather.
Climate Table of Portugal
The climate table of Portugal shows the average temperatures, precipitation, and UV index per month. The table gives an overview of the average day and night temperatures in degrees Celsius, the total amount of precipitation in millimetres, the total snowfall in centimetres, and the UV index for each month. Precipitation is always measured as water, even if it's snow or hail.
Click on the month name to see more weather details, like daily averages, temperatures, and precipitation for the past years in that month.
- Average yearly temperature: 23°C
- Highest temperature: 29°C in July and August
- Lowest temperature: 17°C in January and February
- Precipitation: 311 mm per year, averaging 26 mm per month
- Driest months: 0,1 mm in July, 1,0 mm in August and 4,9 mm in June
- Wettest months: 61 mm in November, 46 mm in October and 45 mm in March
Average Temperature per Month in Portugal
This graph shows the average maximum temperatures per month in Portugal. The temperatures are shown in degrees Celsius and the average is calculated based on the recorded temperatures per month from past years.
Average Precipitation per Month in Portugal
This graph shows how much precipitation Portugal gets on average per month. Precipitation is always measured as water, even if it's snow or hail. This makes it easy to compare how much has fallen, regardless of the form of precipitation. The amount of precipitation is measured in millimetres and the average is calculated based on the recorded precipitation per month from past years.
Average UV Index per Month in Portugal
This graph shows the average UV index per month in Portugal. The UV index indicates the intensity of ultraviolet radiation and ranges from 0 to a maximum of 11.
Yearly Temperature in Portugal
This graph shows the average yearly temperature in Portugal. The yearly temperature, expressed in degrees Celsius, is the average of all twelve monthly temperatures summed up for that year.
Total Yearly Precipitation in Portugal
This chart shows the total yearly precipitation in Portugal over the past few years. The total yearly precipitation, measured in millimetres, is the sum of all the rain that fell in the twelve months of that year.
More Climate Info About Portugal
Portugal is located in south-western Europe on the Iberian Peninsula and has a varied climate that varies from region to region. Portugal's climate ranges from a temperate maritime climate in the north to a warm Mediterranean climate in the south and islands.
From the green, rainy hills of the north to the sunny beaches of the south and exotic islands: Portugal offers a climate for every taste.
North Portugal
The north, especially in areas such as Porto and the Douro Valley, has a temperate maritime climate. Summers are pleasantly warm but less hot than in the south, with average temperatures around 25°C.
The winters are relatively cool and wet, with temperatures rarely falling below zero. This region receives the most rainfall in the country, especially in autumn and winter.
Central Portugal
Middle Portugal, including the capital Lisbon, has a Mediterranean climate. Summers are hot and dry, with temperatures often exceeding 30°C.
.
The winters are milder and wetter than in the north, with average temperatures around 10-15°C. The area is known for its beautiful beaches and attractive summer resorts.
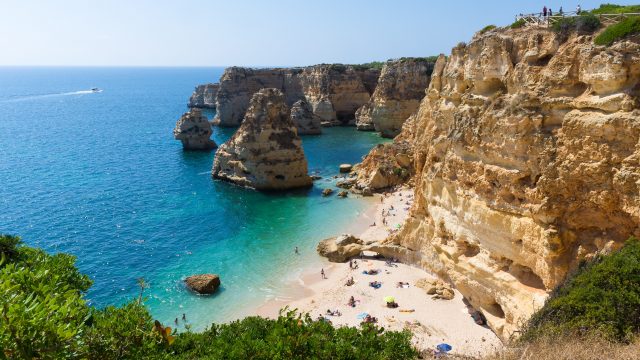
South Portugal / Algarve
The Algarve, in the extreme south of Portugal, has the most stable and warmest climate in the country. It has a typical Mediterranean climate with long, hot summers and short, mild winters.
Summer temperatures are often around 28-30°C, while winters remain mild, averaging around 16°C. The region is popular among tourists, partly because of its abundant sunshine and beautiful coastline.
Madeira and Azores
The Portuguese islands Madeira and Azores have a special climate. Madeira, located closer to the African coast, has a subtropical climate with moderate temperatures throughout the year.
The Azores, located in the Atlantic Ocean, have a temperate maritime climate with more rainfall and cooler temperatures than on the mainland.
Weather experiences in Portugal
The weather in Portugal is rated an average of 4,2 out of 5 stars by 11 visitors. Have you been to Portugal? Share your weather experience to help other visitors.
Write your own review 
 Debbie Sainer – was here in March
We were there for 2 weeks and it rained every single day and it looked like the rain continued for another 2 weeks.
The rain was on and off every day and so there were some signs of sun intermittently. Not what we expected, but the trip was still wonderful.
Not too hot, but still sunny days with pleasant temperatures around 25 degrees. Sometimes it rained a little, but that couldn't spoil the fun.— This text is automatically translated to English
The sun shone more pleasantly than expected and the temperature reached 16 degrees. However, cool mornings and evenings will remain. In short: make sure to pack several layers!— This text is automatically translated to English
 Cecile – was here in March
The weather in Portugal in March is pleasant, with plenty of sunshine and clear blue skies. The weather is generally mild, making it an ideal time for outdoor activities. However, the water is still a bit cool for swimming.— This text is automatically translated to English
In January, Portugal is fairly mild with plenty of sunny days, but it can also be unpredictable and rainy. Not the warmest destination, but certainly more pleasant than many other European locations.— This text is automatically translated to English
Rosalie – was here in April
April in Portugal was great, but not perfect. Although the sun shone most of the time, there were a few rainy days. Temperatures were pleasant. I would definitely recommend it.— This text is automatically translated to English
Janna Morren – was here in May
Unfortunately, there were also some cloudy, slightly cooler days. But in case of rain, it's always cosy inside.— This text is automatically translated to English
Have you been to Portugal?
Share your weather experiences in Portugal.
Average Weather in Portugal by Month
Click on a month below to see detailed weather info for Portugal. Based on historical weather data, you can see the average temperature, precipitation, wind, and UV index for each day of the month.