Average climate of Hokkaido
The climate of Hokkaido has an average yearly temperature of 13°C. Throughout the year, the average monthly temperature can drop to -3°C and rise to 26°C.
Annually, about 1170 mm of rain falls. This gives a good overview of how much rain to expect in Hokkaido. Additionally, about 342 cm of snow falls each year.
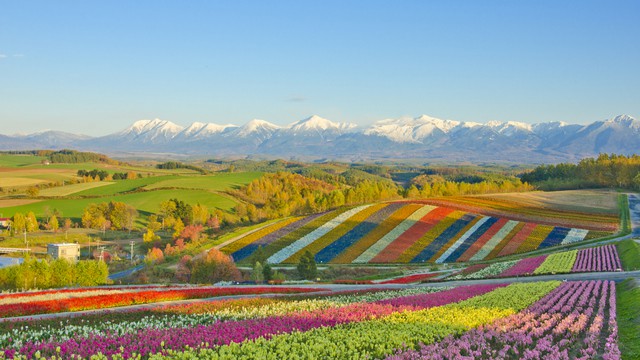
The best time to visit Hokkaido is May. During this period, you will experience pleasant temperatures and not too much rain, making it ideal to visit Hokkaido.
The typhoon season in Hokkaido lasts from early June to late November.
Table of contents
- Average yearly temperature: 13°C
- Highest temperature: 26°C in July and August
- Lowest temperature: -3°C in January
- Precipitation: 1170 mm per year, averaging 98 mm per month
- Driest months: 45 mm in February, 50 mm in January and 62 mm in May
- Wettest months: 190 mm in August, 131 mm in July and 120 mm in November
- Snowfall: 342 cm per year
Climate table Hokkaido
The climate table for Hokkaido shows the average temperatures, precipitation, snowfall, and UV index per month.
| Jan | Feb | Mar | Apr | May | Jun | Jul | Aug | Sep | Oct | Nov | Dec | |
|---|---|---|---|---|---|---|---|---|---|---|---|---|
| Daytime temperature (°C) | -3 | -1 | 5 | 12 | 19 | 22 | 26 | 26 | 22 | 15 | 7 | 0 |
| Nighttime temperature (°C) | -11 | -10 | -4 | 2 | 8 | 12 | 18 | 18 | 13 | 6 | -1 | -7 |
| Precipitation (mm) | 50 | 45 | 73 | 88 | 62 | 97 | 131 | 190 | 112 | 101 | 120 | 101 |
| Snowfall (cm) | 75 | 56 | 78 | 9,3 | 0,4 | 0 | 0 | 0 | 0 | 2,7 | 57 | 64 |
| UV Index | 4 | 5 | 6 | 7 | 7 | 6 | 6 | 6 | 5 | 5 | 3 | 3 |
| Typhoon season | ||||||||||||
| Best month |
Temperature per month in Hokkaido
This graph shows the average high temperatures in degrees Celsius for each month in Hokkaido
Precipitation per month in Hokkaido
This graph shows the average monthly precipitation in millimeters in Hokkaido.
Snowfall per month in Hokkaido
This graph shows the average snowfall in centimeters per month in Hokkaido.
UV index per month in Hokkaido
This graph shows the average UV index per month in Hokkaido.
Yearly temperature in Hokkaido
This graph shows the average yearly temperature in Hokkaido, measured in degrees Celsius.
Yearly total precipitation in Hokkaido
This graph shows the average yearly precipitation in millimeters in Hokkaido.
Yearly snowfall in Hokkaido
This graph shows the average yearly snowfall in Hokkaido, measured in centimeters.
Weather experiences in Hokkaido
The weather in Hokkaido is rated an average of 4,5 out of 5 stars by 13 visitors.
It was snowing with -5 to -7 degrees Celsius. Which was exactly why we visited Sapporo in Hokkaido. To experience the 1st snow of the winter season. And we were not disappointed. We will definitely return for another visit.
Cold, but pure enjoyment!— This text has been automatically translated into English
The sun shone during the day, but it was never too hot. Ideal weather conditions for exploring the beautiful island.— This text has been automatically translated into English
April in Hokkaido gave us a variety of weather conditions - from sunny, warm days to cool, humid days. Flowers were blooming everywhere! Ideal for spring walks. The weather was unpredictable but enchanting.— This text has been automatically translated into English
There was enough snow for winter sports, but sunny days were rare. The average temperature was around freezing. Make sure to wear warm clothes!— This text has been automatically translated into English
Despite the cold, the beautiful snowy landscapes make up for everything. Highly recommended for winter sports enthusiasts.— This text has been automatically translated into English
It was a true winter paradise with heavy snowfall. Ideal for skiing and snowboarding. Clear skies during the day and beautiful winter landscapes. Worth a 5-star review.— This text has been automatically translated into English
It was mostly sunny with moderate temperatures, ideal for sightseeing and outdoor activities. Although this is not a place for sunbathing or winter sports, the weather was perfect for me.— This text has been automatically translated into English
September in Hokkaido was mild, with pleasant temperatures and mostly sunny weather. We had only one day of rain. Although we were not expecting snow, the slight autumn chill was perfect for exploring this beautiful island.— This text has been automatically translated into English
It was cold during the day, but the clear skies at night made it an unforgettable experience.— This text has been automatically translated into English
Cool temperatures of 8 to 17 degrees and a colourful autumn landscape made the walk ideal. Although the pleasant weather is not suitable for swimming or winter sports, it is ideal for sightseeing and hiking.— This text has been automatically translated into English
Although the sun occasionally shone through, it was more often grey and rainy. Temperatures were moderate, not ideal if you are looking for sunshine. The beautiful scenery remained impressive.— This text has been automatically translated into English
Less rain than expected, mostly sunny weather. An ideal spot for summer.— This text has been automatically translated into English
Have you ever been to Hokkaido?
Share your weather experiences in Hokkaido.
Average weather in Hokkaido per month
Click on a month below to see in detail how the weather typically is in Hokkaido and what to expect. Based on the historical weather data of Hokkaido, you can view the average temperature, precipitation, wind, and UV index for each day of the month.