
What’s the climate like in Poland?
The current climate of Poland features average monthly temperatures ranging from highs of 26°C during the day to lows of 3°C. The average yearly temperature is around 15°C. At night, temperatures in the colder months average around -3°C and in the warmer months around 14°C.
The highest temperature recorded in Poland in recent years was 35°C in August 2017. The lowest daytime temperature recorded was -16°C in January 2017.
On average, Poland gets 627 mm of precipitation each year. Of this, about 40 cm is snowfall. For comparison, UK gets 701 mm of precipitation each year.
The climate of Poland is based on weather data from Kraków. Other spots, like WarsawGdańsk, might have different weather. You can check out all destinations in Poland for a full picture of the climate.
Best time to visit Poland?
The best time to visit Poland for sunny weather is May through September. During this period, you'll have good temperatures and not too much rain, making it a great time to visit Poland. In the other months of the year, there's too much rain or the temperature isn't ideal for a visit if you want sunny and pleasant weather.
Climate Table of Poland
The climate table of Poland shows the average temperatures, precipitation, snow, and UV index per month. The table gives an overview of the average day and night temperatures in degrees Celsius, the total amount of precipitation in millimetres, the total snowfall in centimetres, and the UV index for each month. Precipitation is always measured as water, even if it's snow or hail.
| Jan | Feb | Mar | Apr | May | Jun | Jul | Aug | Sep | Oct | Nov | Dec | |
|---|---|---|---|---|---|---|---|---|---|---|---|---|
| Temp. max (°C) | 3 | 6 | 10 | 15 | 19 | 24 | 26 | 26 | 21 | 15 | 9 | 5 |
| Temp. min (°C) | -2 | -2 | 0 | 4 | 9 | 13 | 15 | 15 | 11 | 6 | 2 | -1 |
| Precipitation | ||||||||||||
| Precipitation (mm) | 43 | 37 | 22 | 43 | 74 | 47 | 90 | 87 | 67 | 52 | 35 | 30 |
| Snow (cm) | 13 | 8,9 | 2,0 | 2,7 | 0 | 0 | 0 | 0 | 0 | 0,2 | 3,9 | 9,6 |
| UV Index | 2 | 4 | 5 | 8 | 8 | 7 | 8 | 8 | 6 | 4 | 2 | 1 |
Click on the month name to see more weather details, like daily averages, temperatures, and precipitation for the past years in that month.
- Average yearly temperature: 15°C
- Highest temperature: 26°C in July and August
- Lowest temperature: 3°C in January
- Precipitation*: 627 mm per year, averaging 52 mm per month
- Snowfall: 40 cm per year
- Driest months: 22 mm in March, 30 mm in December and 35 mm in November
- Wettest months: 90 mm in July, 87 mm in August and 74 mm in May
*Precipitation is measured as a combination of rain, snow, and hail
Plan your next holiday
Don’t miss the best holiday deals for Poland and see what our partners have for you.

Weather experiences in Poland
Good![]()
![]()
![]()
![]()
Frozen lakes and snow-covered forests create beautiful lands... more
Good![]()
![]()
![]()
![]()
Nice and warm, but not too hot, ideal for walking and relaxi... more
Popular destinations in Poland
Discover the climate of these popular destinations in Poland.
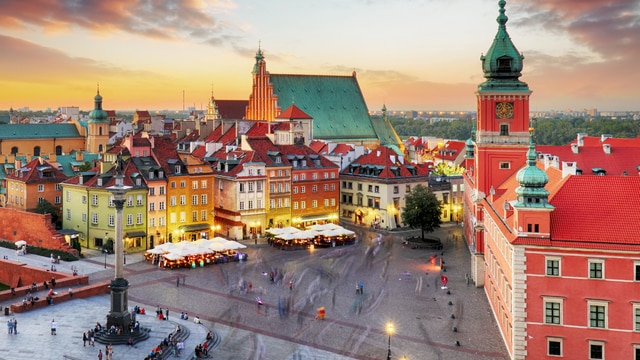


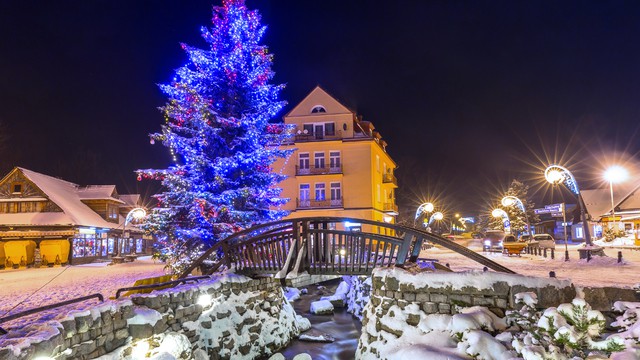
Table of Contents
Average Temperature per Month in Poland
This graph shows the average maximum temperatures per month in Poland. The temperatures are shown in degrees Celsius and the average is calculated based on the recorded temperatures per month from past years.
Average Precipitation per Month in Poland
This graph shows how much precipitation Poland gets on average per month. Precipitation is always measured as water, even if it's snow or hail. This makes it easy to compare how much has fallen, regardless of the form of precipitation. The amount of precipitation is measured in millimetres and the average is calculated based on the recorded precipitation per month from past years.
Average Snowfall per Month in Poland
This graph shows how much snow Poland gets on average per month. The amount of snowfall is measured in centimetres and the average is calculated based on the recorded snowfall per month from past years.
Average UV Index per Month in Poland
This graph shows the average UV index per month in Poland. The UV index indicates the intensity of ultraviolet radiation and ranges from 0 to a maximum of 11.
Yearly Temperature in Poland
This graph shows the average yearly temperature in Poland. The yearly temperature, expressed in degrees Celsius, is the average of all twelve monthly temperatures summed up for that year.
Total Yearly Precipitation in Poland
This chart shows the total yearly precipitation in Poland over the past few years. The total yearly precipitation, measured in millimetres, is the sum of all the rain that fell in the twelve months of that year.
Total Yearly Snowfall in Poland
This chart shows the total yearly snowfall in Poland over the past few years. The total yearly snowfall, measured in centimetres, is the sum of all the snow that fell in the twelve months of that year.
Weather experiences in Poland
The weather in Poland is rated an average of 3 out of 5 stars by 6 visitors. Have you been to Poland? Share your weather experience to help other visitors.
Write your own reviewFrozen lakes and snow-covered forests create beautiful landscapes. Less pleasant if you don't like the cold.— This text is automatically translated to English
An icy coldness took hold of me. Despite the icy landscape, the snow made everything beautiful. Ideal for winter lovers, less so for heat lovers.— This text is automatically translated to English
Nice and warm, but not too hot, ideal for walking and relaxing. There were a few days of rain, but overall the weather was good.— This text is automatically translated to English
Unpredictable snowstorms made the holiday even more difficult.— This text is automatically translated to English
There was heavy snowfall, which made travelling difficult at times. But fair is fair: the snowy landscape made the weather picturesque.— This text is automatically translated to English
Summer in Poland was pleasant, with temperatures ranging from 20-30 degrees and lots of sunshine. However, the occasional rain shower but that did not spoil the fun. An umbrella is recommended.— This text is automatically translated to English
Have you been to Poland?
Share your weather experiences in Poland.
Average Weather in Poland by Month
Click on a month below to see detailed weather info for Poland. Based on historical weather data, you can see the average temperature, precipitation, wind, and UV index for each day of the month.